8 Ocak 2014 Çarşamba

fooplot


FOOPLOT  


FooPlot is an online graphing calculator and function plotter. FooPlot is an open source application which you can access source code and you can modify it. You can draw a function using with this web based application.

FooPlot supports various functions as like below:

Trigonometric functions: sin(x), cos(x), tan(x), sec(x), csc(x), cot(x), asin(x), acos(x), atan(x), asec(x), acsc(x), acot(x)

Hyperbolic trigonometric functions:

sinh(x), cosh(x), tanh(x), sech(x), csch(x), coth(x), asinh(x), acosh(x), atanh(x), asech(x), acsch(x), acoth(x)
Miscellaneous:
  ln(x), log(x), sqrt(x), abs(x), floor(x), ceil(x), u(x)
Min/Max:
  min(expression1,expression2,expression3,...)
  max(expression1,expression2,expression3,...)
FooPlot has good properties. You can save your graph output as a PDF/EPS/PNG/SVG file. FooPlot supports π and e numbers. You can create a permalink for your graph and you can share this permalink if you want.   
  

View of x^4-6x^3+7x^2+3x-4 graph:


you can view multiple graph at the same time like:


FooPlot looks like on you browser: 


Using of FooPlot is very easy. You can write the function in text box at the right side. Then press enter key on you keyboard.


FooPlot can be used in schools, labs. It can be helpful for students, teachers. And you can use it at home for specific purposes.


One day, if you want to know that what the graph log(pi*x) + sec(60) looks like? Just then, you can visit FooPlot web site and you can see what the graph appearance.

to learn more click here  


A&G GRAPHER


A&G GRAPHER


Graphing equations has never been any easier.Just type down the desired 
equation (y=sinx+x^2) and click draw to plot the equation.  


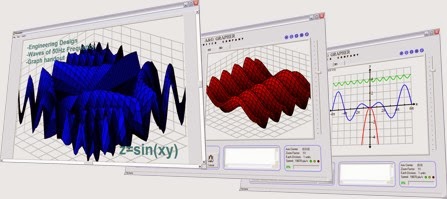
ADVANCED EQUATİON GRAPHER; Graph equations of any complexity A&G grapher handle any combination of x,y,z variables.Equations can be as simple as  y=sinx or as complex as y+xy=3sin(x) . 


You are viewing a picture of the programs menu above.     


 Use tools for analyzing and modifying the plotted graphs. Tools for rotation, matrix manupulation, computation of area under the curve , plootting slopes and  tracing graphs. Grahps can be printed, or saved as  picture files or copied and pasted in your word document.


  to learn more click here

7 Ocak 2014 Salı

graphsketch


GRAPHSKETCH 

Name as on the various complex and simple this program helps us to draw graphs of of functions.Furthermore,Graph Sketch is very useful program .Usually it is very difficult to create a graph, drawing graph points, but through this program, this problem is eliminated.Graph sketch is very easy to be drawn in the given function with graph.According to the x and y axes, function points and the graphics are drawn.If we try to give some examples;


 You are now viewing the above graph of sine and cosine functions.   

 
furthermore you are viewing the graph of log(x) and exp(x) functions.


x^3-8x+5,arcsin(x),square root of x graphics;


(x-3)(x+10)(x-14)/100;


Finally,graph sketch is very useful for math and also qualified trainers.I think , the difficulty of drawing the graph can draw the chart may also seek the through this program. All students and teachers can use this program easily because it is not complex.In this program you can get the given places and graphics functions.


To learn more, click here.